Recently, Google announced they are now factoring pagespeed scores into search rankings. With this, Google’s own pagespeed tool, Pagespeed Insights has been in the forefront. There is logic here; afterall, Google’s results with pagespeed must surely factor in their own pagespeed tool. However, back in November, Pagespeed Insights backend was torn out and replaced with a tool called Lighthouse.
Lighthouse is a website auditing tool that started as a Chrome extension, and provides a lot of meaningful suggestions and data to developers. Let me say that again: to developers. I’m here to cut through it all and lay everything out for everyone to understand.
What a Pagespeed Insights Report Means
The report may need some explaining. The overall score is based on several criteria, condensed to a score between 0 to 100. The first metric you will see is data on the site’s load time. You will see measurements such as ‘First Contentful Paint,’ which is when the first bit of content appears on screen; and ‘First Meaningful Paint,’ which is when the first screen of the site finishes loading.
The two numbers most important here are First Contentful Paint and Time to Interactive, which is a good measurement of when the site finishes the majority of its load. A site’s load speed is the biggest contributing factor to its pagespeed score. Load speed in itself is mainly a function of the server the site is on, and the site’s overall weight. Any combination of these being good and another being poor can result in a great pagespeed score. If you have a blazing fast server and a heavy page, you can still get a high pagespeed score.
What are Opportunities?
Underneath the load metrics, there might be a list of items called ‘Opportunities’. The ‘Opportunities’ section is not a list of recommended optimizations, and making any of those changes may not affect your pagespeed in any meaningful way. Some are easy to implement, such as GZip compression, deferring script loads, and image compression.
Others, however, do very little while being extremely disruptive to development. One of these is ‘Eliminate render-blocking resources,’ which means separating your styles and scripts so each page loads only the scripts and styles necessary for that page. This sounds good in practice, but is a maintenance nightmare for sites built on CMSs, like WordPress.
Another opportunity often listed is ‘Serve images in next-gen formats’. You should be familiar with the usual image formats that are used on the web, such as jpg, gif, png. Next-Gen image formats have higher compression and smaller sizes, without quality loss. These formats are JPEG2000, JPEG XR, and WebP. At the time being, there is no universally agreed upon image format with very little cross-browser support.
JPEG 2000 is only supported on Safari; JPEG XR is IE only; and WebP, with the most browser support, works on Edge, Firefox and Chrome. If you would want to bet on one standard, then WebP has most support. WebP is also a proprietary Google image format that’s been heavily pushed by Google as an improvement to web standards. However, the Pagespeed Insights measurement for savings with next-gen image formats is itself questionable.
As an example, let’s use Hebrew National Hotdogs; they make a good product and a fairly fast website. Let’s look at their Pagespeed Insights results.
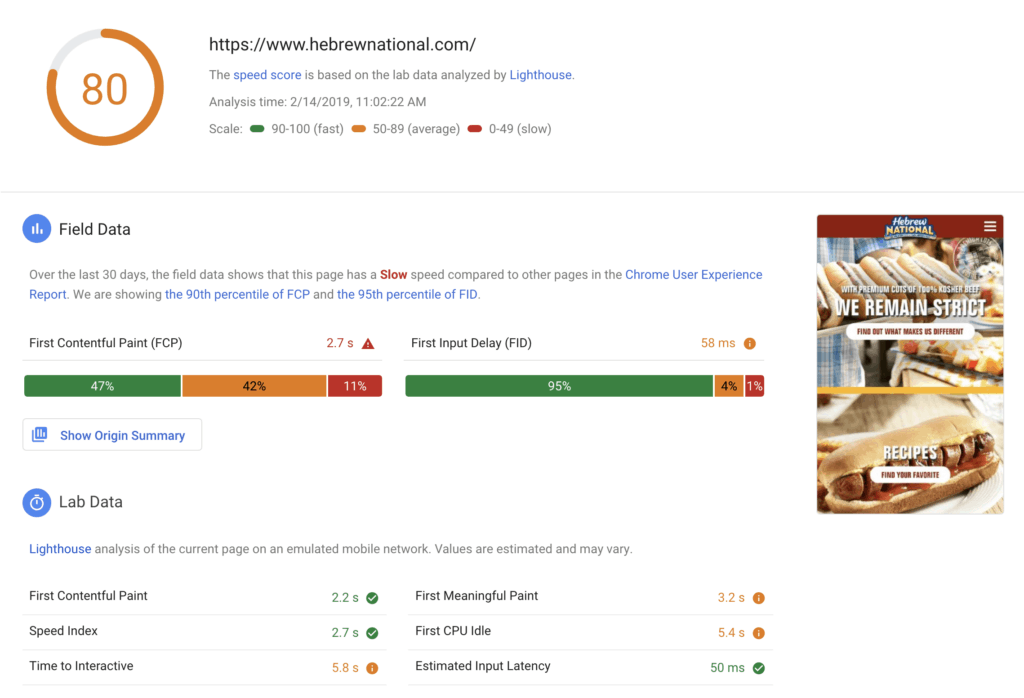
The site scores well with an 80 mobile score (this time; we’ll cover that later). However, if you look at the opportunities, at the top is the ‘Next-Gen Images’ listing.
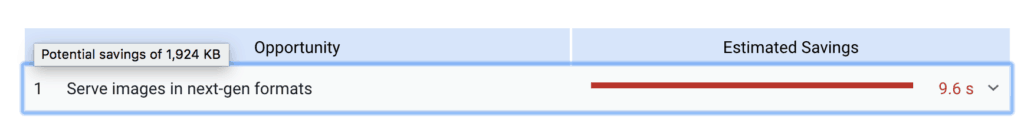
Here, you will see the estimated time on the page’s load time is 9.6 seconds. The site loads in 5.6 seconds, but WebP will save you 9.6 seconds. I really want this to sink in.
There is confusing language on the Pagespeed report. If pressed, Google engineers will tell you that ‘opportunities’ are not failed checklist items, but optimization opportunities that you can or cannot use depending on the site’s use-case and audience. This is contradicted in the actual report where it lists opportunities taken as ‘passed audit items’.
How Pagespeed Insights Calculates Mobile Score
Site weight and server speed affects pagespeed more than the site’s code. A small site with few images and very little javascript will score much higher than a site with more interactive elements. Nearly most competently coded sites will score in the high 80s to 100 on the Desktop pagespeed score.
The Mobile score is based on an emulated mobile network speed; a simulated 3G network at 1.6mb/s. However, almost 93% of current mobile subscribers are using LTE 4G, and the average mobile speed in the United States is 27.33 mb per second, almost 20 times faster than the emulated mobile network.
The score also has a consistency problem; if run 4 times in 4 minutes, you can see 4 different results with scores that can range up to 20 points.
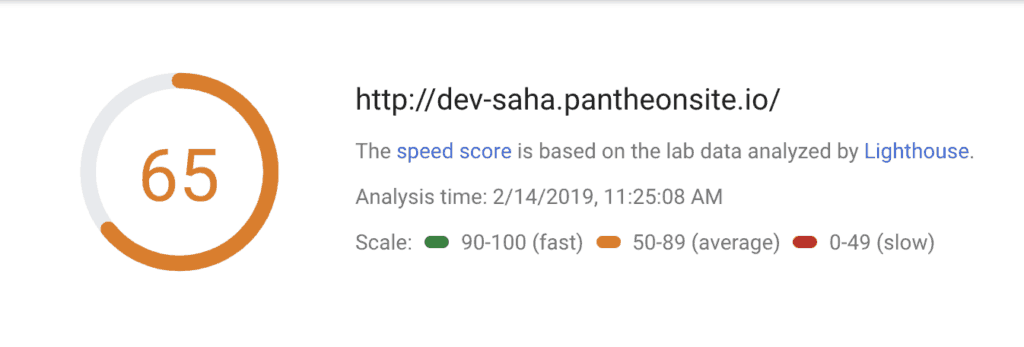
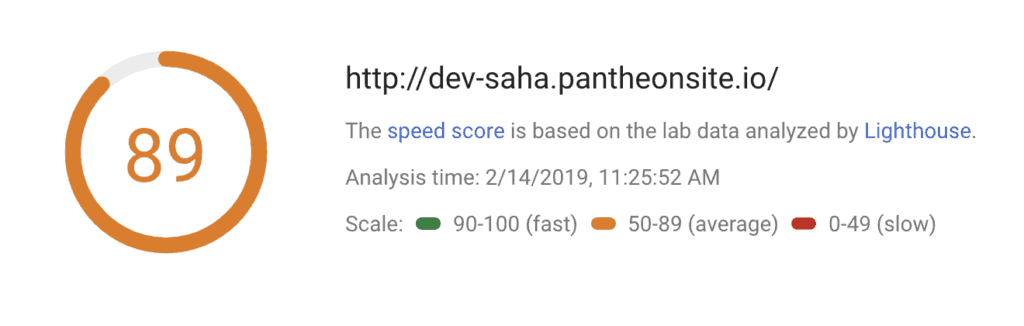
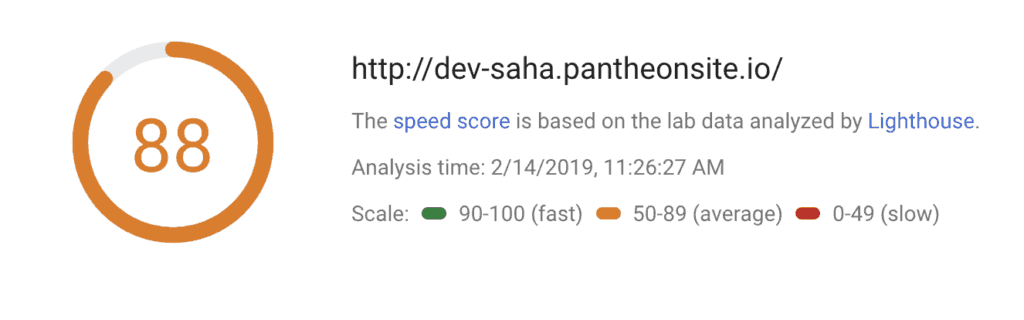
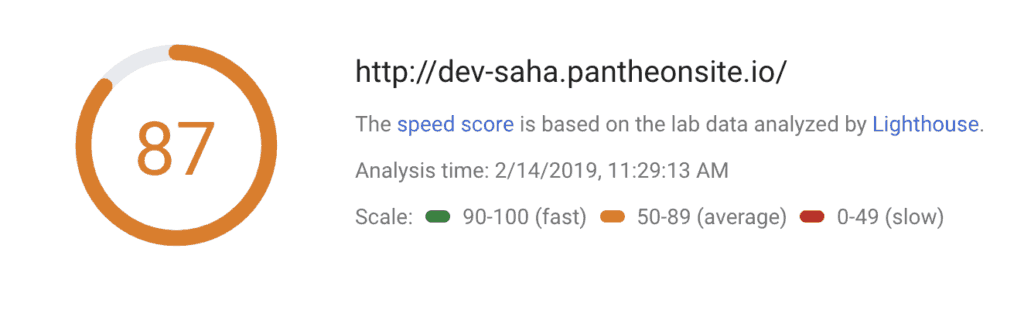
Depending on several uncontrollable criteria such as server load and time of day, your score will fluctuate.
How Should I Measure Site Performance?
Pagespeed Insights, and its underlying tool Lighthouse, are developer-based tools that deliver information meant for developers, not end-users. Lighthouse should have never been used as Pagespeed Insight’s engine, because the language in the report is technical and not for the end-user.
Pingdom and GTMetrics are both excellent site performance tools, and using all three is part of the procedure at PAVLOV when we launch a new site.
Interested in learning more, or seeing how PAVLOV can improve your website performance? Contact us at [email protected] today!